Scirius Enterprise Edition
An appliance providing a web application for central management for Stamus Networks intrusion detection probes and custom probes running the open source Suricata IDS.
Central management and log centralization for Suricata based probes
Scirius EE allows for fully centralizing Stamus Networks probes configuration management as well as log centralization. It also features our innovative Run Your Own Defense system. It provides multiple sources/multiple rulesets central management of any existing Linux based Suricata installation. Scirus Enterprise is agentless and comes with secure https and role based access.
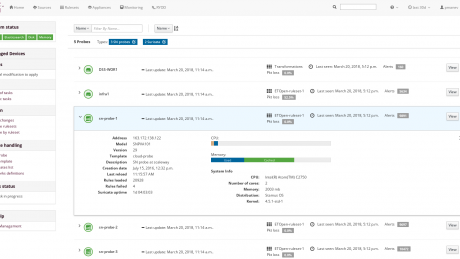
Appliances main page
See status of appliances and have an immediate visibility of the critical device details via easy list, filter and search options.
Probe statistics
Get statistics for each probe and diagnose potential issue.
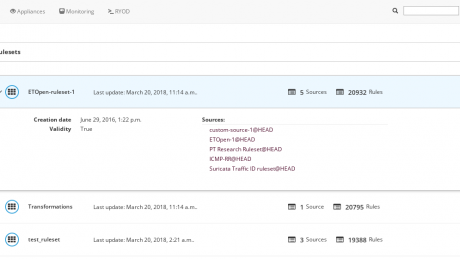
Rulesets
Define multiple ruleset sources per ruleset.
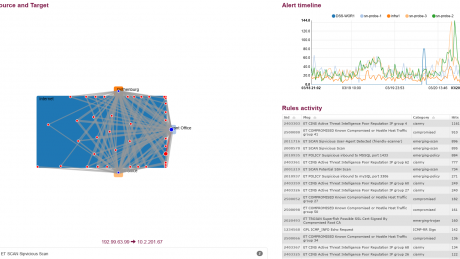
Target illumination
Review your organisational target illumination and get a fast understanding of ongoing targeting.
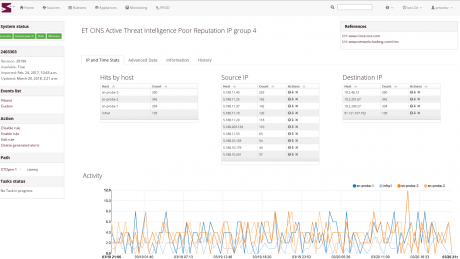
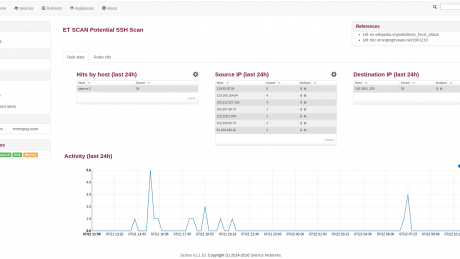
Detailed alert views
Advanced drill down and per device alert views with possibility to disable/suppress/threshold/transform a rule.
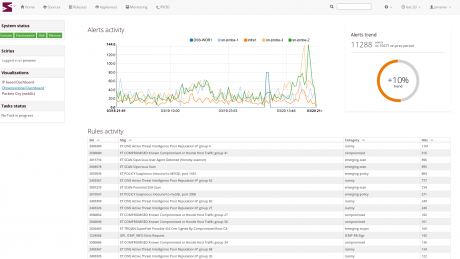
Trends
Devices alert trending and rules activity.
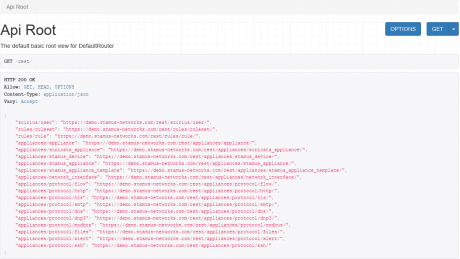
RestAPI
RestAPI possibilities for easier management.
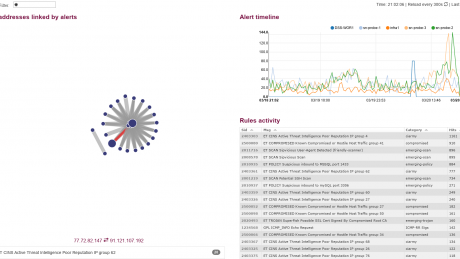
Alert correlation
IP vs alert groups correlation.
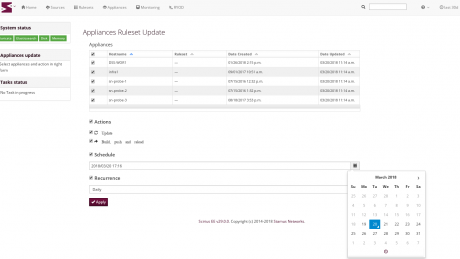
Task scheduling
Schedule task or create periodic task to at once upgrade ruleset or update configuration of multiple probes.
Rule activity page
Understand activity of a rule and modulate its verbosity globaly of by IP address in a few clicks.
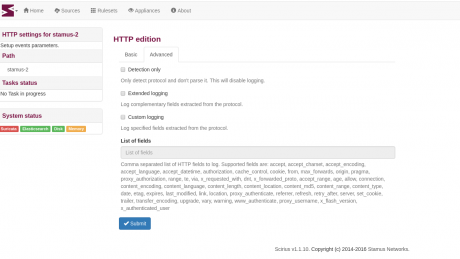
Stamus probe configuration
Configure all aspects of Stamus probes. From IDS tuning to the configuration of metadata logging.
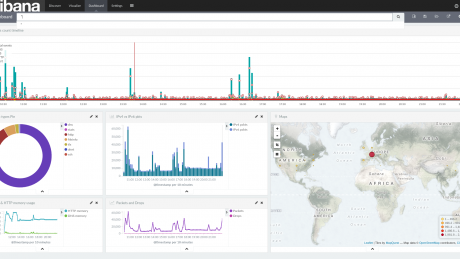
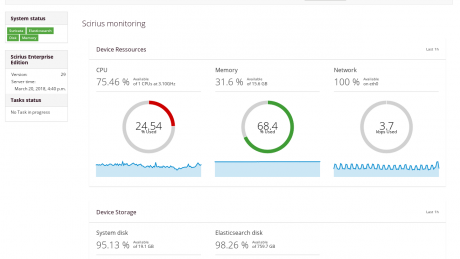
Included dashboards
Display probes statistics and genereted events in dashboards
Major features
Multi probes
Full central management for multiple Stamus Probes. Also compatible with custom Suricata Linux based probes for ruleset management.
Manage multiple rulesets, multiple sources, logs and dashboards.View Suricata performance.
RYOD
Run Your Own Defense containers allowing for any custom action required on the data/logs.
Deploy external code or custom code to interact with your information system. Do specific analysis on data such as Indicator Of Compromise testing.
Tasks scheduling
Allowing for managing multiple probes in parallel, secure and on demand or scheduled manner.
Do mulitple configuration change and and schedule a global deployment. Define periodic tasks such as refreshing rules sources and other data.
Role based access
Implement different level of access and audit user actions.
Agentless
No need for agent installations on the probes and administrator side.
Log centralization
Collect and analyze logs from any Suricata installation.
Scirius CE vs Scirius EE comparison
|
Scirius Community Edition |
Scirius Enterprise Edition |
|
|
Availability and services |
|
|
|
Hardware appliance |
|
|
|
Software appliance |
|
|
|
Virtual appliance (VMWare, Amazon AMI) |
|
|
|
Enterprise support |
|
|
|
Ruleset management |
|
|
|
Multi probes |
|
|
|
Multi sources |
|
|
|
Multi rulesets |
|
|
|
Custom rules support |
|
|
|
Scheduled update |
|
|
|
Suppression and threshold |
|
|
|
Lateral movement and target illumination |
|
|
|
System management |
|
|
|
Configuration management of Stamus IDS probes |
|
|
|
Backup and restoration of configurations |
|
|
|
Export, import and management of dashboards |
|
|
|
System upgrade for Stamus appliances |
|
|
|
System and Suricata status information panel |
|
|
|
Offline upgrade for air gapped sites |
|
|
|
Option to monitor via Datadog |
|
|
|
Configuration of multiples probes via hierarchical templates |
|
|
|
VPN (anywhere) probe registration |
|
|
|
Full Rest API |
|
|
|
Log centralization and analysis |
|
|
|
No data loss log transfer |
|
|
|
Events storage in Elasticsearch |
|
|
|
Support of existing Elasticsearch cluster connection |
|
|
|
Log shipping from non Stamus – custom Suricata probes |
|
|
|
Log events forwarding |
|
|
|
Logging to Splunk |
|
|
|
Run Your Own Defense |
|
|
|
User managed container |
|
|
|
Web management interface |
|
|
|
Role based access |
|
|
|
HTTPS access |
|
|
|
Agent less |
|
|
|
Authentication via LDAP and Active Directory |
|
|
Contact us or ask for a demo
If you have a question, would like more information or a demo about Scirius Enterprise Edition or about Stamus Networks technology and products, please fill in the form below and someone will contact you shortly.
[hubspot type=form portal=6344338 id=d423d56b-2e9b-4f48-bade-e8a1402c4a8d]